
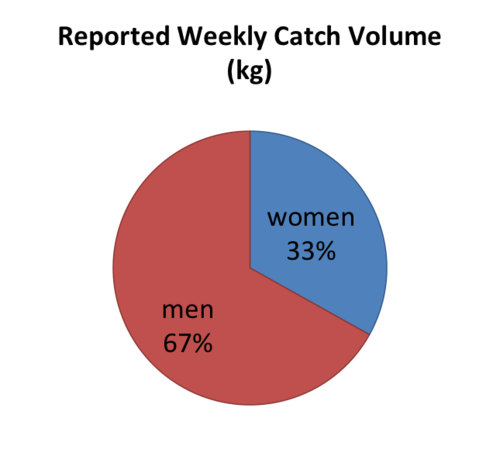
I know what you’re thinking. It’s just a freaking pie chart, why should that take so long? Well my friends this pie chart represents 600 interviews of people in 12 communities, and converting answers like “10 pieces of fish every other friday” into numeric data takes a bit of time.
But of course in the end it’s not the time that matters, it’s what this pie means that really counts. And to get to that I need to first explain where the numbers come from.
METHODS:
My intrepid research assistants interviewed 300 women and 300 men about their fishing habits. We asked them to tell us things like their typical catch volume, how often they went out per week, and how much time they spent fishing during each trip. From this I can calculate a number of things, but in this case I calculated weekly catch volume. I then add up everything women catch, and then everything men catch, pop it into a pie chart and VOILA! I should mention for the die hard methods people out there that the respondents were randomly selected, and we found the proportion of women and men participating in fishing activities were very similar (83% of women and 85% of men) so using equal number of interviews was appropriate.
This pie shows that women, who according to most people don’t fish, still magically manage to be responsible for 1 out of every 3 kg of marine life that gets extracted from the ocean. Now I realize I’m biased, and my judgement is only further blinkered by several weeks worth of data entry (I’ve been dreaming in numbers), but please believe me when I tell you that this is kind of a big deal. Women fish. And it makes up one third of the catch volume. Booya.
The next thing you should do is doubt my data. How could women possibly be catching all that if they don’t fish? The answer has to do with semantics. [Aside: about a decade ago I had a long conversation with my college math professor about why feminist researchers make such a big deal about semantics. So Christopher, 10 years later here is my example.]
It has to do with how we define the words “fishing” and “fisher”. Most of the time when people quantify community fishing activities they only talk to people who self identify as fishers. In many ways this seems to make sense, but in reality can wreak havoc with the data because there is a big difference between the number of people that call themselves fishers (and their activities as fishing), and the number of people that extract animals from the ocean. And the difference is largely made up of women.
[Note: this argument is based on the scale of data collection. If you are focused on only one fisheries then it makes sense to focus on only those that participate. I’m talking about research that scales up to the community, region, or international level.]
Women, for a variety of cultural and social reasons rarely self describe as fishers. And furthermore the extractive activity that women predominately participate in (gleaning), is rarely considered a form of fishing. So a woman in a boat lifting a net? She’s not really fishing, she’s just helping her husband. A woman walking around the intertidal area with a huge bucket and a machete? She’s just gleaning.
You can see why I wouldn’t take this assessment at face value. So for the purposes of my research I defined fishing as what people did, rather than how they defined that activity. Gleaning extracts animals from the ocean and is therefore fishing. ”I’m just helping my husband” shares all the characteristics of fishing, so it too is counted as fishing.
And what do you get? A delicious data pie.
Danika Kleiber